Unpacking Council Benchmarking - Operational Expenditure
We recently published an article looking at council Capex across the country, which aimed to unpack where councils were allocating capex across activities.
The article caused quite a stir, and we’ve subsequently had a number of requests to do the same for operational expenditure (opex).
Never ones to shy away from a challenge, we’ve done exactly that, and have taken a look at Stats NZ's Local authority financial statistics to see how councils performed across their opex spend in the year ended June 2024.
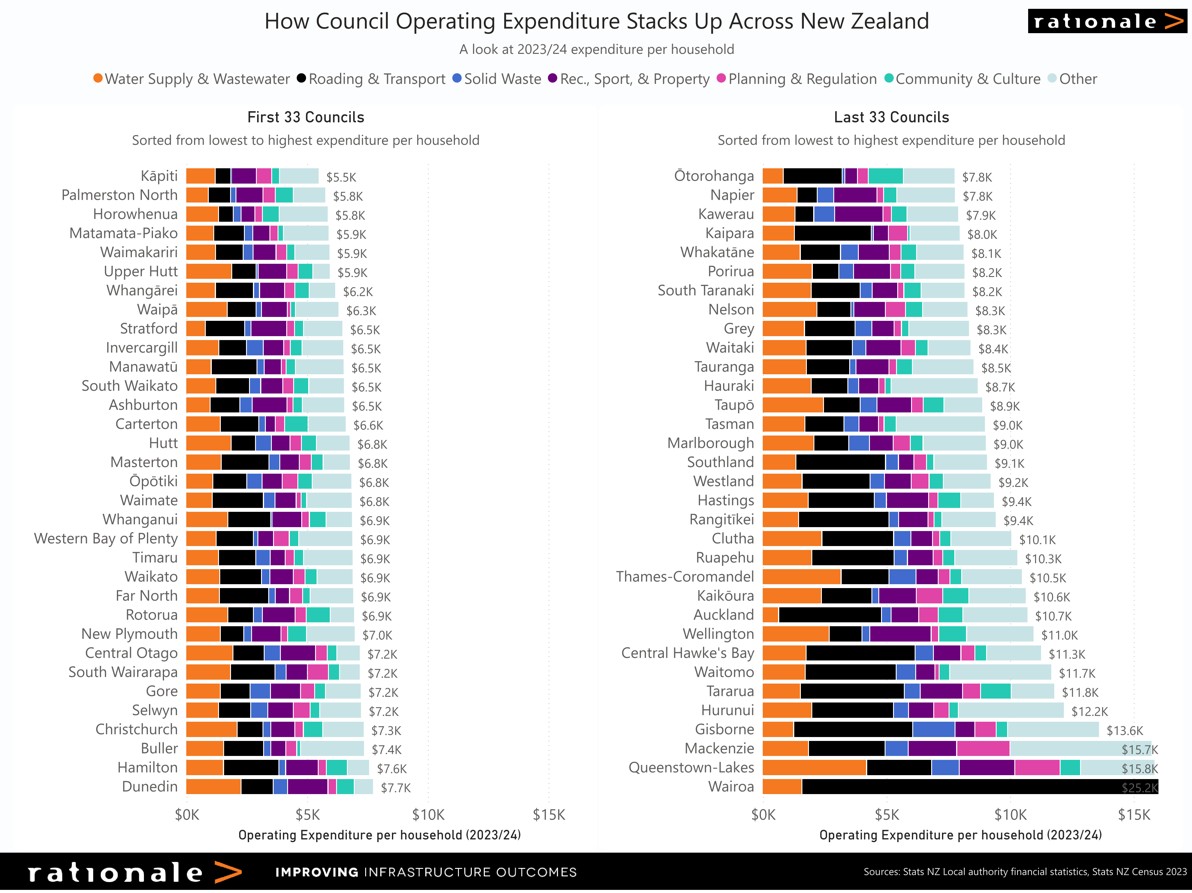
We have analysed the data to show the opex spend per household and then breaking it down across the following activities:
- Water Supply & Wastewater
- Roading & Transport
- Solid waste
- Sport, Recreation & Property
- Planning & Regulation
- Community & Culture (incl. Community development, Culture, and Economic Development)
- Other (incl. Governance and Corporate Services, Emergency Management, Environmental Protection, and all other activities)
It is important to note that the measures below don’t directly reflect the rates residents pay, and don’t account for non-rate council revenue, including government funding. As always, the devil is in the detail. Some councils have received grants from government to help with recovery, roading and other activities. Others receive considerable amount of rates from utility providers and non-resident ratepayers, such as local power generators, which significantly offsets the cost per ratepayer – but isn’t shown in the data provided.
As an example, expenditure in the Mackenzie District includes significant activities funded through non-rates sources, which would not otherwise be incurred. There are also specific expenditures funded by targeted rates that don’t apply to households. Examples of ‘Other’ expenditure specific to Mackenzie, which has offsetting revenue are commercial activity including forestry operating and harvesting expenses, airport expenses from special funds, regional events funded by Central Government, and the A2O cycle trail.

Click here to see a full sized image
Once again, we have found that councils, by and large, are not spending their money on nice to haves, but are targeting their opex on activities that are designed to keep the lights on and ensure communities continue to be well functioning, enjoyable and healthy places to live.
Despite perceptions of council bloat, the data shows local authorities are primarily maintaining core services such as pipes, roads, and essential facilities, rather than pouring money into optional extras. Rising household costs reflect scale constraints and infrastructure renewal needs, not frivolous spending.
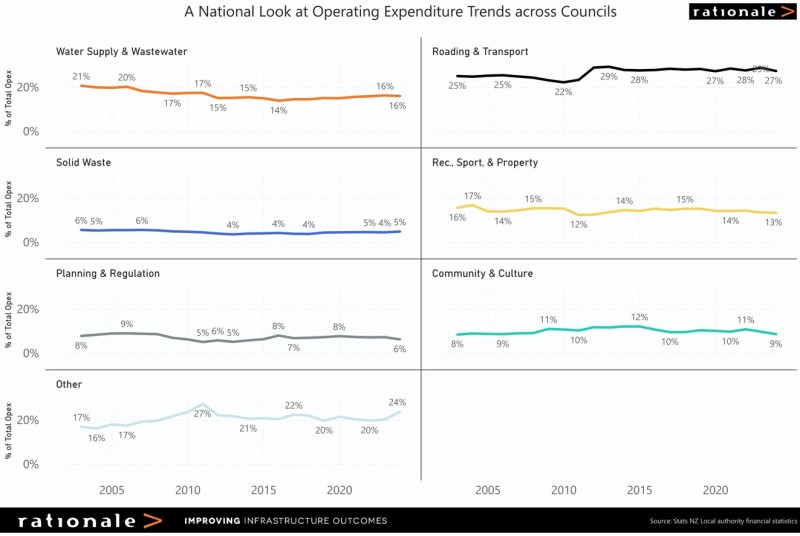
Unsurprisingly (at least to us), core infrastructure dominates council opex, with 48% going towards Water Supply & Wastewater, Roading & Transport, and Solid Waste. These are fundamental services that underpin how a district functions. Spending on them has been stable for nearly two decades, which suggests councils aren’t spending funds to ‘vanity projects’, but focusing on maintaining the basics.
While often criticised as ‘non-core activities’ (we disagree with this by the way), Recreation, Sport & Property and Community & Culture together account for only about 22% of total opex nationwide (13% and 9% respectively). Moreover, the share for Recreation, Sport & Property has declined steadily from about 17% in 2004 to 13% in 2024.
There are some outliers - Queenstown Lakes and Mackenzie clearly show the challenges faced by districts with relatively small numbers of ratepayers that are facing significant population growth, coupled with the increased pressures that come with very high visitor numbers and the impact this has across council functions.
Areas such as Gisborne, Central Hawke’s Bay and Wairoa show the costs associated with roading and transport in response to recent significant weather events, and the cleanup involved.
What is also interesting is that spending as a percentage across activities hasn’t varied much since 2005. Looking at the detail, Water & Wastewater dropped slightly from 21% to 16%, Roading & Transport has shown a slight rise from 25% to 27% and Planning & Regulation and Community & Culture has remained almost flat.
Click here to see a full sized image
We have also mapped where councils sit in relation to the cost per household versus the number of people in the district. There are a huge range of insights you can draw looking at this, but one broad trend is that the smaller provincial and rural councils have a harder time keeping their costs per household down. This is due to a range of factors, which in our experience often includes a large, dispersed district, a low population base and a range of challenges around infrastructure – particularly roading and three waters.

Click here to see a full sized image
We know that each council has a set of circumstances and challenges that are specific to that district, and while the above information is really useful for comparing councils nationally, it doesn’t dive into the reasons as to why. Some councils are performing ‘better’ than others when looked at through this lens, but this doesn’t tell the full story.
If you would like to know more about why certain councils have performed differently to others, please get in touch – we are always happy to dive into the detail and provide answers to any questions you might have.
BACK